$10.47 billion in 2025. $3.16 billion for the veneer slice within a decade. A 54.90% revenue share already held by Asia Pacific. Those are the numbers framing the 2027 stone cladding outlook, and they say something important: the market is not flat, not shrinking, and not waiting for anyone.
Two verified market reports anchor this outlook. Polaris Market Research projects the natural stone market to grow from USD 10.47 billion in 2025 to USD 16.87 billion by 2034 at a 5.44% CAGR. Wall cladding leads as the fastest-growing application. ResearchAndMarkets puts stone veneer at USD 2.45 billion in 2024, reaching USD 3.16 billion by 2030 at about a 4.18% CAGR. This article translates those forecasts into practical planning: where demand is emerging, which products are taking share, and what a wholesaler should do before the calendar flips.

- Natural stone grows from USD 10.47B (2025) to USD 16.87B (2034) at 5.44% CAGR; wall cladding is the fastest-growing application.
- Stone veneer reaches USD 3.16B by 2030 (~4.18% CAGR); about 40% of new commercial buildings in North America used stone veneer in 2023.
- Asia Pacific holds 54.90% of revenue; North America ~20.15%; renovation outpaces new construction at 5.97% CAGR.
- Thin veneer and panelized systems keep taking share as weight, freight, and labor economics favor them.
- Interlocking Z-panels, ready L-corners, and 50+ color programs are the product-level trends to plan around.
- A 20-25 working day production window plus 1-3 day samples lets wholesalers pre-book capacity without gambling.
The 2027 Baseline: Two Markets Converging
Track natural stone and stone veneer as separate lines and they converge in 2027. The broader stone market grows steadily at 5.44% CAGR toward USD 16.87 billion by 2034, powered by urbanization, infrastructure spending, and renovation. The veneer segment grows at its own clip, ~4.18% CAGR to USD 3.16 billion by 2030. Its installed reach expands faster than its dollar share, because thin systems cover more wall per dollar.
Three structural drivers do most of the work. Government infrastructure investment keeps raising aggregate stone demand. Urbanization adds millions of square meters of new facades each year. And renovation — the fastest-growing construction type at 5.97% CAGR — feeds the veneer sector directly, because retrofit customers want the look without the demolition and weight of full-thickness stone.
For a wholesaler, the baseline means demand is dependable. The question is not whether orders come; it is whether your color line, lead time, and pricing match what the market moves to.
| Market line | Size and forecast | Growth signal |
|---|---|---|
| Natural stone | USD 10.47B (2025) to 16.87B (2034) | 5.44% CAGR; cladding fastest application |
| Stone veneer | USD 2.45B (2024) to 3.16B (2030) | ~4.18% CAGR; panel share climbing |
| Renovation vs new build | Renovation fastest type | 5.97% CAGR overtakes new construction |
| Regional weight | APAC 54.90%, NA ~20.15% | Emerging markets lead volume |
Why Wall Cladding Is the Fast-Growing Application
Polaris calls it directly: wall cladding is the fastest-growing application segment in natural stone. Flooring still holds the largest share at 43.81%, but the growth margin sits on walls. The reason is a materials collision — veneer economics meeting facade demand.
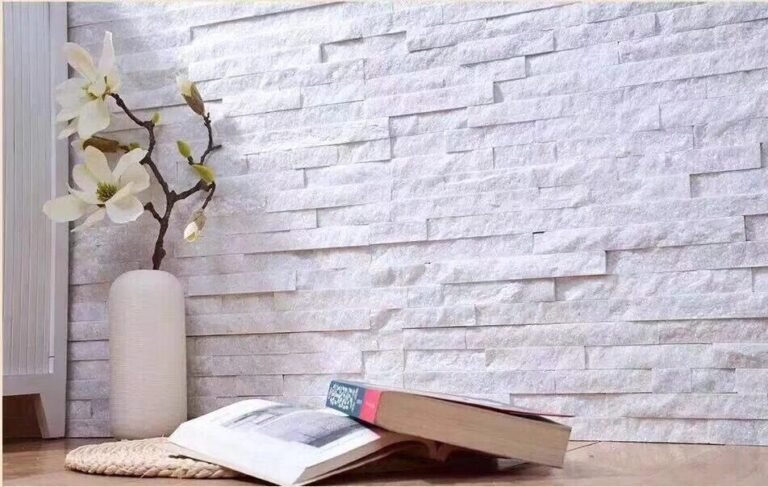
Buyers get the stone look with a panel that weighs a fraction of full-depth stone, ships denser, and installs in days instead of weeks. The natural thin stone veneer guide on this site documents the substitution already underway. Panelized products convert that momentum into finished walls: pre-assembled stacked stone panels, thin ledgestone strips, and interlocking systems reduce the on-site judgment calls that slow masonry work.
Commercial uptake makes the segment’s growth durable. Roughly 40% of new commercial buildings in North America used stone veneer in 2023, and hospitality, retail, and office lobbies keep specifying textured walls because they photograph and age well. That is not a style fad; it is a procurement default.
Emerging Markets Reshape Demand
The geography of the stone business changed under everyone’s feet. Asia Pacific already accounts for 54.90% of natural stone revenue, and North America about 20.15%. The 2027 picture is not one market; it is several moving at different speeds.
Asia Pacific leads on volume and infrastructure. Government-funded projects convert directly into facade and paving demand, and regional manufacturing keeps pricing competitive. For importers anywhere else, that means sourcing from established Chinese hubs remains the cost-effective default, and capability keeps upgrading with scale.
North America’s growth is commercial and renovation led. The report’s data — 40% of new commercial buildings using stone veneer — shows adoption has moved past early adopters. Europe adds a different driver: an aging building stock whose renovation and restoration cycle favors thin natural systems that do not require structural rework.

The buyer’s takeaway: plan a portfolio, not a single mix. Volume lines for infrastructure-heavy regions, ready-to-install panels for commercial North America, and thin profiles for European retrofit. The emerging-market story is not “one country to watch.” It is several segments growing on different rails.
New Product Trends for 2027
Forecasts describe volume; product trends describe the mix. Four shifts look durable into 2027, and each maps to a concrete factory capability rather than a mood.
Thin veneer keeps taking share. The weight, freight, and labor economics all favor thin systems. A 36x10cm ultra-thin ledgestone panel ties into a container with far more coverage than full-depth blocks, which improves the emissions and freight story the sustainability conversation demands.
Panelization wins the wall. Pre-assembled panels — stacked stone at 15x60cm or 15x55cm, Z-panels at 20x55cm or 15.2x61cm — replace hand-laid masonry on commercial jobs. Ready L-corner kits cut about 50% of corner labor, and pre-made corners eliminate the field miter where finish quality usually breaks.
Interlocking systems speed installs. Interlocking Z-panels answer the contractor’s real question — how fast can this wall go up — and the segment floor in the data reflects that preference for engineered, fast systems.
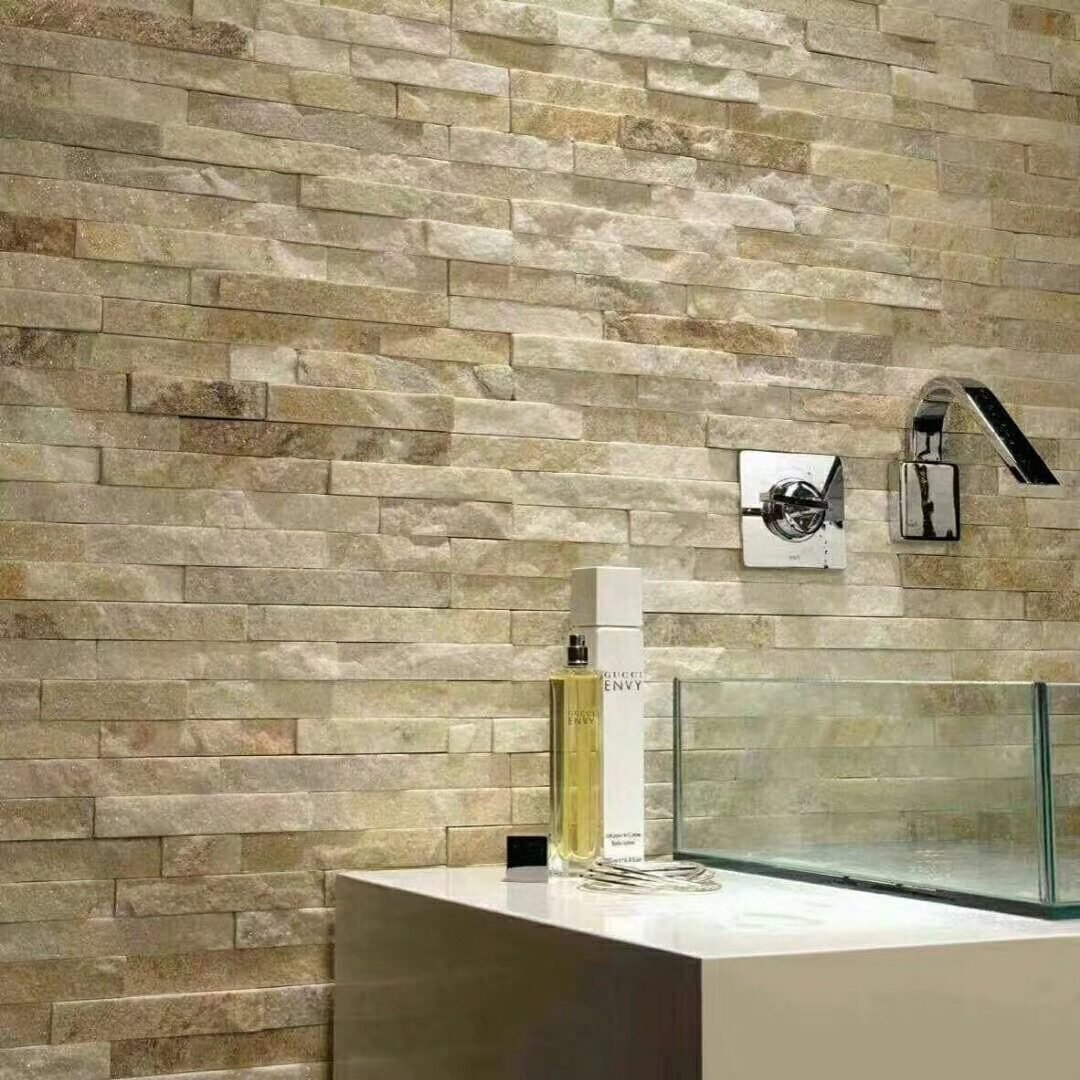
Color programs broaden. With more than 50 colors across slate, quartzite, sandstone, and marble, specification is no longer limited to grey. Batch-specific vein selection holds color transition consistency above 95%, which lets a designer choose charcoal, rust, cream, or green-grey without accepting patchwork.
None of these trends is new in isolation; what changes is that they are converging. Thin, panelized, corner-ready, color-broad systems are becoming the default spec, not the premium option.
What This Means for Wholesale Buyers
Translate the outlook into a procurement calendar and the actions become concrete. Start with the product mix: weight the inventory toward thin veneer and panelized systems that match the fastest-growing segments, and add ready L-corner kits to every stacked stone order.
Lock color programs early. The trending palettes — warm greys, earthy browns, subtle greens — come from the same vein-sort process. Ordering one vein-locked program for the year beats matching colors order by order, and the factory’s batch-specific vein selection makes reorders fit the original run.
Use samples and test reports before the container commitment. Physical samples move in 1-3 days from Top Stone Panels, and documents like COO, ISPM 15, and pre-shipment inspection records follow each load. A wholesaler who verifies before ordering does not have to explain a color mismatch to a contractor in June.
| Planning lever | 2027 action | Factory support |
|---|---|---|
| Product mix | Shift to thin panels and panelized lines | Six lines incl. 36x10cm ledgestone |
| Color program | Book one vein-locked run for the year | 50+ colors, 95%+ consistency |
| Corners | Order L-corner kits with panels | Pre-made, ~50% corner labor saved |
| Capacity | Reserve production before peak | 20-25 working days standard |
| Verification | Sample, test report, COO, ISPM 15 | 1-3 day samples; documents per load |
The scheduling side is equally clear. Standard production runs 20-25 working days, and first orders with custom cartons run 25-30 days. MOQ is one 20-foot container per line. That gives a buyer a real planning horizon — order before the peak months and the container lands when the season demands it. Our seasonal demand guide covers the timing question in detail.
The Factory Position
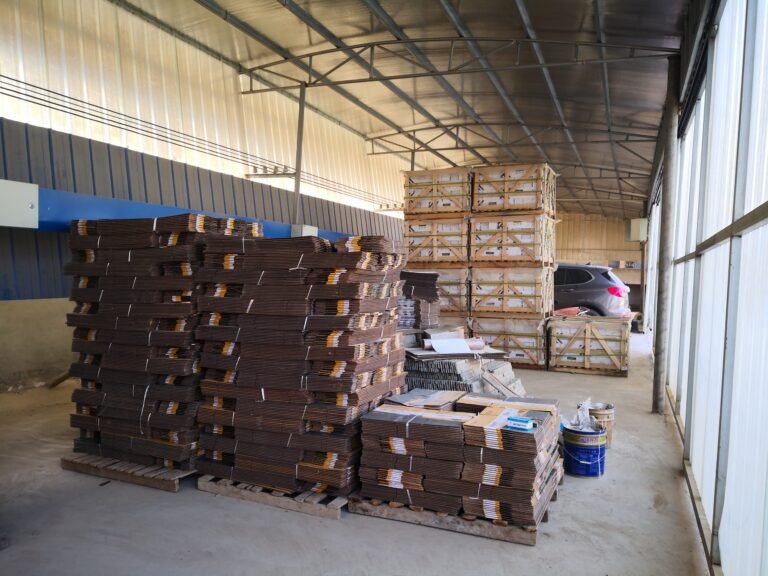
The outlook favors suppliers that already produce what the trends describe. Top Stone Panels sits in that position by construction. It is an own-quarry operation in Hebei shipping 220+ containers a year. Capacity spans six product lines — stacked stone, thin ledgestone, interlocking Z-panels, thin stone veneer, flagstone, and columns.
Production volume confirms the trend bet. The factory turns 80,000 m² of stacked stone monthly and 60,000 m² of thin ledgestone. Z-panels run 50,000 m², thin veneer 40,000 m², flagstone 30,000 m², and column kits 10,000 units a month. Those are operating numbers, not projections; the lines exist because the demand already does.
Quality controls make the scale repeatable. Marine-grade epoxy, cement, or mesh backing arrives factory-applied. Infrared CNC diamond-blade cutting holds tolerance, and the 3-step QC — raw material selection, in-process re-inspection, pre-shipment final inspection — keeps defects out of the container. For wholesalers, the complete stone panel buying guide walks through what to verify at each step.
Logistics is engineered around the same repeatability. The Zero-Breakage Packaging Protocol — 3-5 layer reinforced cartons, fumigation-free pallets, 4-6 steel bands, and airbags — protects the load. FOB Xingang, EXW, CIF, and DDP terms let buyers choose where the risk and freight management sit.

Where the Outlook Could Go Wrong
An honest outlook names its failure modes. Freight cost spikes can compress landed-cost math for trans-oceanic imports, and the thin-veneers’ weight advantage moderates that pressure without removing it. Currency swings shift quote competitiveness faster than factory pricing does.
Demand concentration carries its own risk. When one region drives more than half of revenue, a slowdown there dampens global numbers, even if North America and Europe keep growing. Importers should treat regional diversification as inventory policy, not commentary.
Finally, quality variance remains the industry’s quiet risk. As thin panels take share, the difference between a factory’s advertised tolerance and its shipped tolerance decides whether contractors return. The flatness and warpage control guide and the water absorption guide document the metrics that separate reliable suppliers from spec-sheet suppliers.
FAQ
Will the stone cladding market keep growing in 2027?
Market data projects continued growth: natural stone to reach USD 16.87 billion by 2034 at 5.44% CAGR, with wall cladding the fastest-growing application segment.
Which regions are emerging for stone cladding demand?
Asia Pacific leads natural stone revenue at 54.90%, North America holds about 20.15% with strong commercial uptake, and Europe’s aging stock feeds renovation demand.
What product trends will shape 2027?
Thin veneer and panelized systems keep taking share from full-thickness stone, joined by interlocking Z-panels, ready L-corner kits, and broader vein-locked color programs.
How should wholesale buyers plan for 2027?
Lock vein-consistent color programs for the year, order samples and test reports before container commitment, and reserve production within the 20-25 working day lead time.
Is thin veneer replacing full-thickness stone?
The substitution is well underway. Roughly 40% of new commercial buildings in North America used stone veneer in 2023, and thin systems keep winning on weight, freight, and labor.
Conclusion
The 2027 stone cladding outlook rewards prepared buyers. Demand grows — USD 16.87 billion for natural stone by 2034, ~4.18% CAGR for veneer — and the growth sits in cladding, renovation, and regions already set up to buy. Thin and panelized systems take share, corners and colors sell on arrival, and a 20-25 working day production window stays a real planning tool.
- Keep the mix weighted toward thin veneer and panelized systems with ready L-corners.
- Book a vein-locked color program for the year; match reorders to the original run.
- Verify with samples, test reports, COO, and ISPM 15 before the container commitment.
- Diversify across regions to damp the risk of any single market stalling.
Top Stone Panels produces the six lines and 50+ colors the outlook favors, shipped from an own-quarry operation in Hebei at 220+ containers a year. To turn the outlook into a 2027 order plan, request samples and a factory quotation, or review the stacked stone and thin ledgestone lines that lead the panel segment.