If you track one number in global stone trade, make it this one: China exported US$5.03 billion of stone products in 2024 — down 20.9% from the year before, on roughly flat volume of 7.81 million tons. Value fell, volume held, and that split tells buyers more than any headline about a “collapsing” stone market. What collapsed was pricing and product mix, not shipments.
This article maps the trade data a B2B buyer actually needs: who exports, who imports, where US demand sits, and how the 2024-2025 tariff reset changed the math for importing stone from China. Figures come from customs-compiled industry data and first-party shipping records from Top Stone Panels, a Yixian slate and culture-stone factory exporting 220+ containers a year since 2005.
- China leads stone exports at US$5.03 billion (2024), but export value fell 20.9% while volume stayed flat — a pricing and mix story, not a demand collapse.
- The United States is the largest single import market: over US$2.3 billion and 3 million tons in the 2021 annual snapshot, from Brazil, Italy, India, China, and Turkey.
- China imports stone too — 11.04 million tons in 2024 — mainly from India (26.9%) and Turkey (15.8%), mostly as raw blocks for its processing clusters.
- US tariffs on Chinese-origin goods, including the 20% across-the-board measure from March 2025, have changed landed-cost math and made DDP and lane choice central decisions.
- Granite is recovering faster than marble; 2024 half-year granite panel output grew 1.3% against a still-soft marble run.
- Who Exports Stone: The Country Order
- Who Imports Stone: Demand Lives in Building Markets
- China’s Export Machine: Volume Down, Value Volatile
- What the US Market Really Buys
- Tariffs and Trade Policy: The 2025 Reset
- Six Product Lines, One Shipping Lane
- Where 2026 Volume Is Moving
- Reading Trade Data Like a Buyer
- FAQ
- Conclusion
Who Exports Stone: The Country Order
The export map has one clear leader and a cluster of specialists. China sits alone at the top of worked-stone export value. Italy follows as the benchmark for marble and high-design processing. India and Brazil scale granite at competitive prices, Turkey anchors marble and travertine, and Spain rounds out the volume group with quartz slabs and processed stone.
| Exporter | Export strength | What buyers use it for |
|---|---|---|
| China | Worked stone and culture-stone panels; US$5.03B export value in 2024 | Veneer, cladding, ledgestone, slate and quartzite panels at container scale |
| Italy | Marble processing and design stone | High-end facade and interior specification work |
| India | Granite and sandstone volume; biggest raw-block supplier to China | Granite slabs, pavers, and block re-exports through Asian processors |
| Turkey | Marble and travertine | Marble slabs, travertine, and the #2 raw-block source for China |
| Brazil | Granite blocks and slabs; top US supplier by value | Granite slabs for US fabrication and export processing |
| Spain | Quartz surfacing and processed stone | Quartz slabs and engineered-to-natural blends |
China’s leadership is not granite alone. Its export strength in slate veneer, culture stone, and panelized formats — the products that ship from factories like Top Stone Panels — sits outside the slab story. That matters when buyers read aggregate statistics and conclude all Chinese stone is granite; the culture-stone lane behaves differently from the slab lane.
Who Imports Stone: Demand Lives in Building Markets
Import demand clusters where construction and renovation spend is dense. The United States is the largest single market for natural stone by value, supported by residential and light commercial renovation. Europe splits across Germany, the Netherlands, France, and the UK, buying processed stone and veneer through distribution. Asia-Japan, South Korea, and Australia round out the high-value importers with strong facade and outdoor-living stone programs. The Gulf states buy heavily on the facade side for hospitality and civic projects.
| Import market | Demand driver | What moves |
|---|---|---|
| United States | Renovation, distribution, facade work | Granite slabs, marble, quartz product, slate veneer, ledgestone |
| Germany, Netherlands, France, UK | Commercial facades, retail, remodels | Veneer panels, cladding, processed stone |
| Japan, South Korea, Australia | Premium residential and garden stone | Slate, quartzite, flagstone, cultural stone |
| Saudi Arabia, UAE | Hospitality and civic construction | Marble, granite, large-format facade panels |
The buyers worth watching are distributors with warehouse capacity, not direct construction firms. Distribution channels smooth the lumpy project demand and buy in container repeats; the trade data for panel products is largely distributor-driven on both sides of the Atlantic.
China’s Export Machine: Volume Down, Value Volatile
The 2024 numbers deserve a careful reading before anyone writes off Chinese stone. Export volume of 7.81 million tons held roughly flat (down 0.2%), while export value fell 20.9% to US$5.03 billion. Volume that stable with value that volatile means unit prices compressed, mix shifted to lower-value formats, or both — a pricing squeeze, not a disappearing industry.
China imports as hard as it exports. In 2024 imports reached 11.04 million tons, up 3.5%, with India at 26.9% of volume and Turkey at 15.8%. Those blocks feed the country’s giant processing clusters, which cut and finish stone for re-export. A buyer who only tracks Chinese exports misses half the picture: the processing machine depends on imported raw material as much as its own quarries.
Production data reinforces the shift. China’s panel output measured about 820 million square meters in 2023, down 8.6% from the year before, while 2024 half-year granite panel output rose 1.3% — a selective recovery in granite while marble continues to soften. The split echoes what exports show: granite is the resilient lane, marble the volatile one.
Within China, the regional story splits further. Hebei’s Yixian belt produces slate and culture stone quarry-direct, while Fujian’s Shuitou and Xiamen clusters process and trade at world scale. Our Hebei vs Fujian factory comparison maps which region fits which order, and the B2B sourcing guide for Chinese cladding shows how to buy into that structure without the middle layers.
What the US Market Really Buys
The United States runs the world’s deepest demand pool for imported natural stone. In the most recent widely published annual customs snapshot (2021), US natural stone imports exceeded US$2.3 billion on more than 3 million tons. The supplier mix is a case study in specialization: Brazil led at 32.7% on granite slabs, Italy took 17.3% on marble and design stone, India 14.4%, China 12.4% on veneer and culture-stone formats, and Turkey 10.9% on marble and travertine.
Two product rails run through the US data. Raw-to-slab materials — Brazilian granite, Turkish marble, Indian sandstone — feed the fabrication shops that supply countertops and monumental work. Panelized products — slate veneer, ledgestone, split-face cladding — flow through distribution to hardscape and exterior contractors. The second rail is the lane Top Stone Panels ships into, and it is the one where Chinese factories compete on container economics.
US buyers also carry a structural habit worth noting: they buy through distribution and expect stockable, repeatable formats. That is why panel sizes like 15x60cm stacked stone and 36x10cm ledgestone became export standards — they fit a distribution SKU system, not a site-specific order.
Tariffs and Trade Policy: The 2025 Reset
The 2025 tariff sequence changed the economics of importing stone from China. Section 301 duties on Chinese goods, unchanged for many worked-stone lines, were joined by an across-the-board additional tariff that reached 20% in March 2025. The applied rate on a Chinese stone entry is now MFN plus those stacked measures, and it has moved repeatedly since 2018.
Buyers responded in three predictable ways: they re-checked the applied duty at booking; they asked for DDP quotes so the duty risk sits in one delivered price; and some split lanes between Chinese, Indian, and Brazilian supply. The effect on aggregate data will take a year to show up, but the structural shift is visible in every quote request — landed cost, not FOB price, is now the number being compared. Our importing stone to the USA guide walks the full duty and entry checklist, and the import lead-time planner factors the new clearance buffer into production scheduling.
Tariffs do not remove US demand for natural stone; they raise the cost of a specific supply lane. Factories that keep the documentation stack clean — COO, ISPM 15, pre-shipment inspection video — keep the entry fast, and that is the edge that survives a tariff cycle.
Six Product Lines, One Shipping Lane
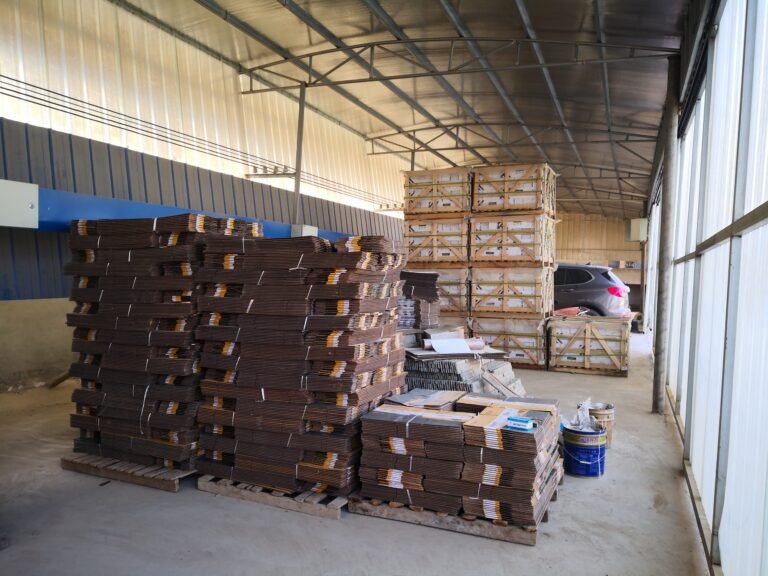
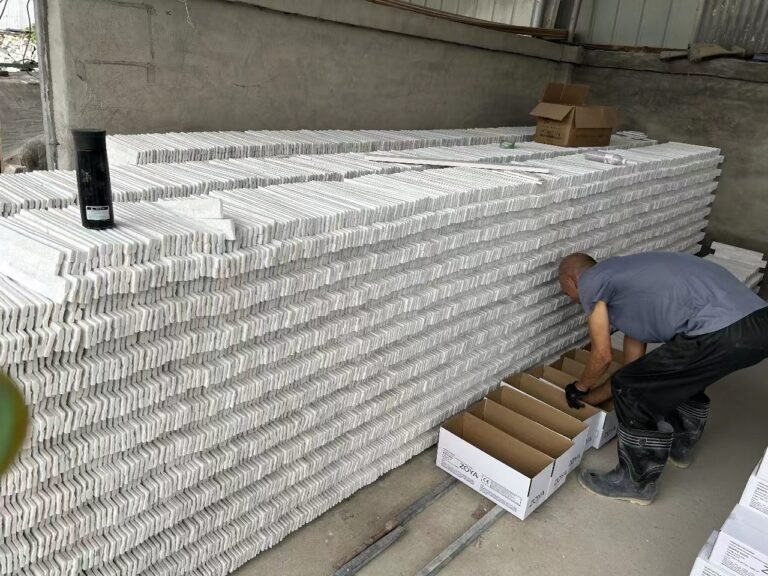
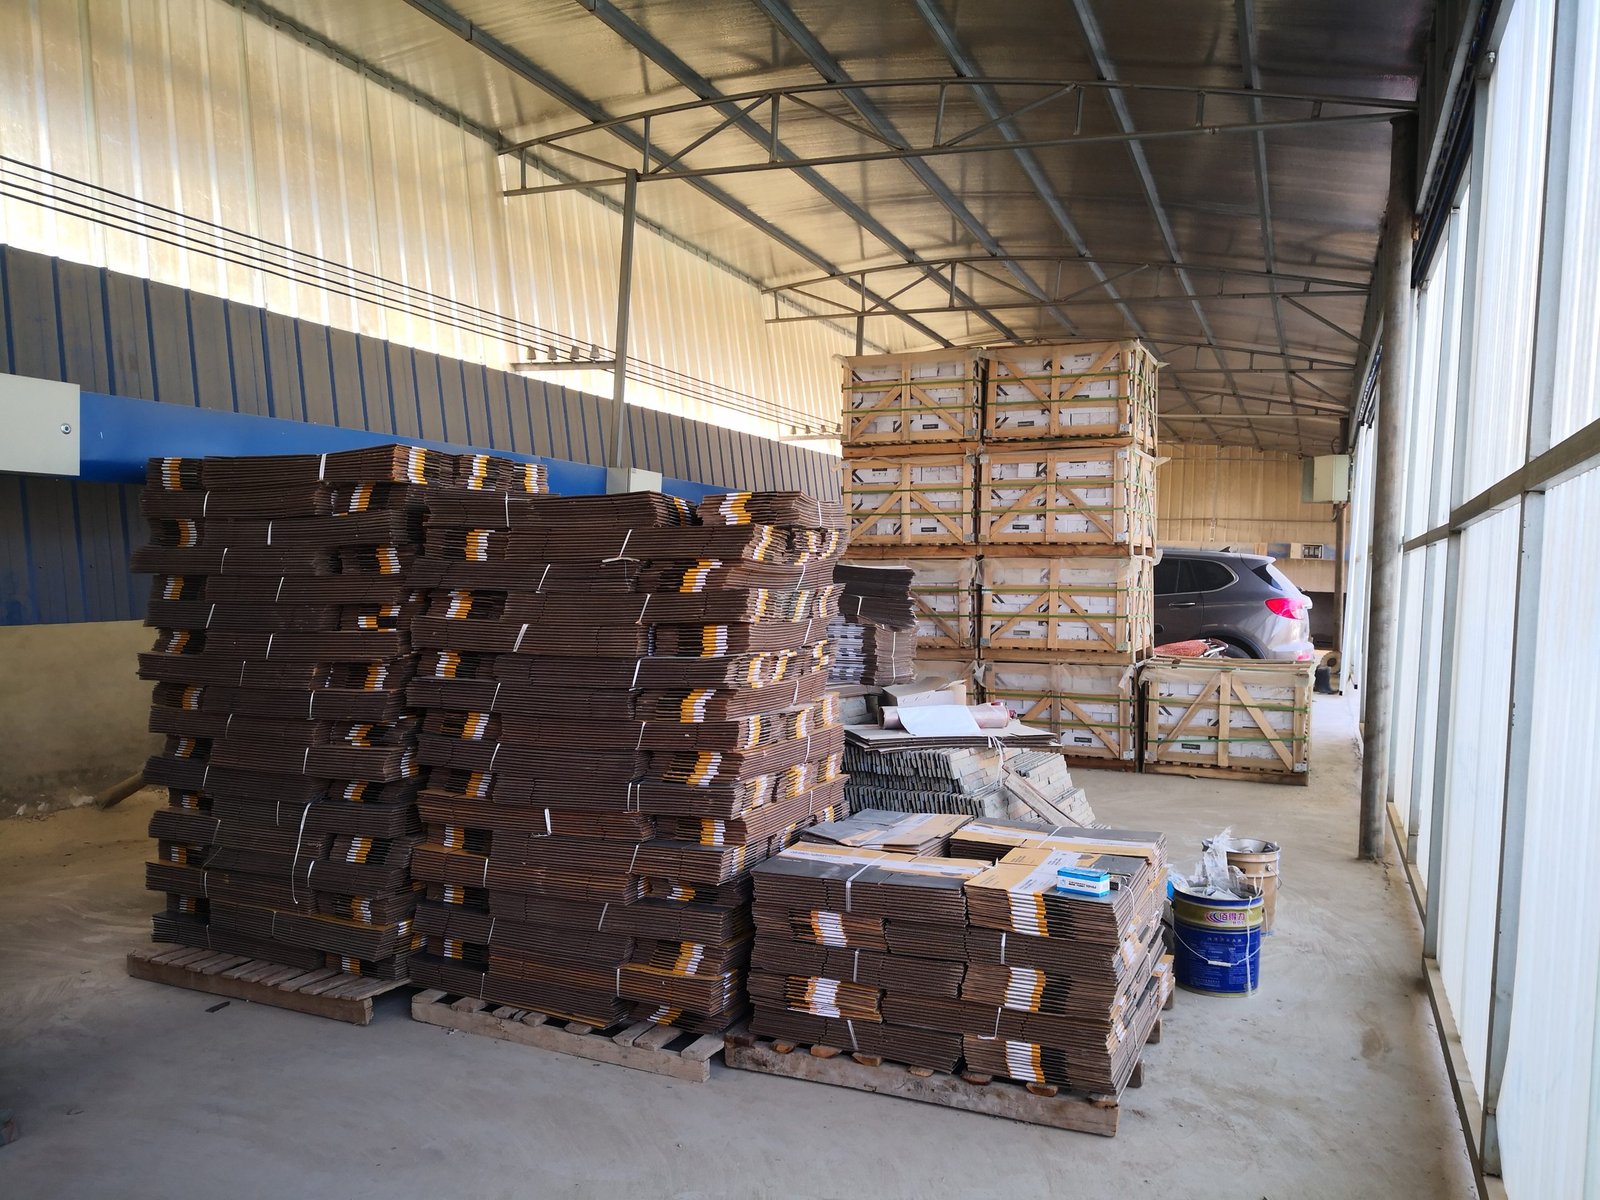
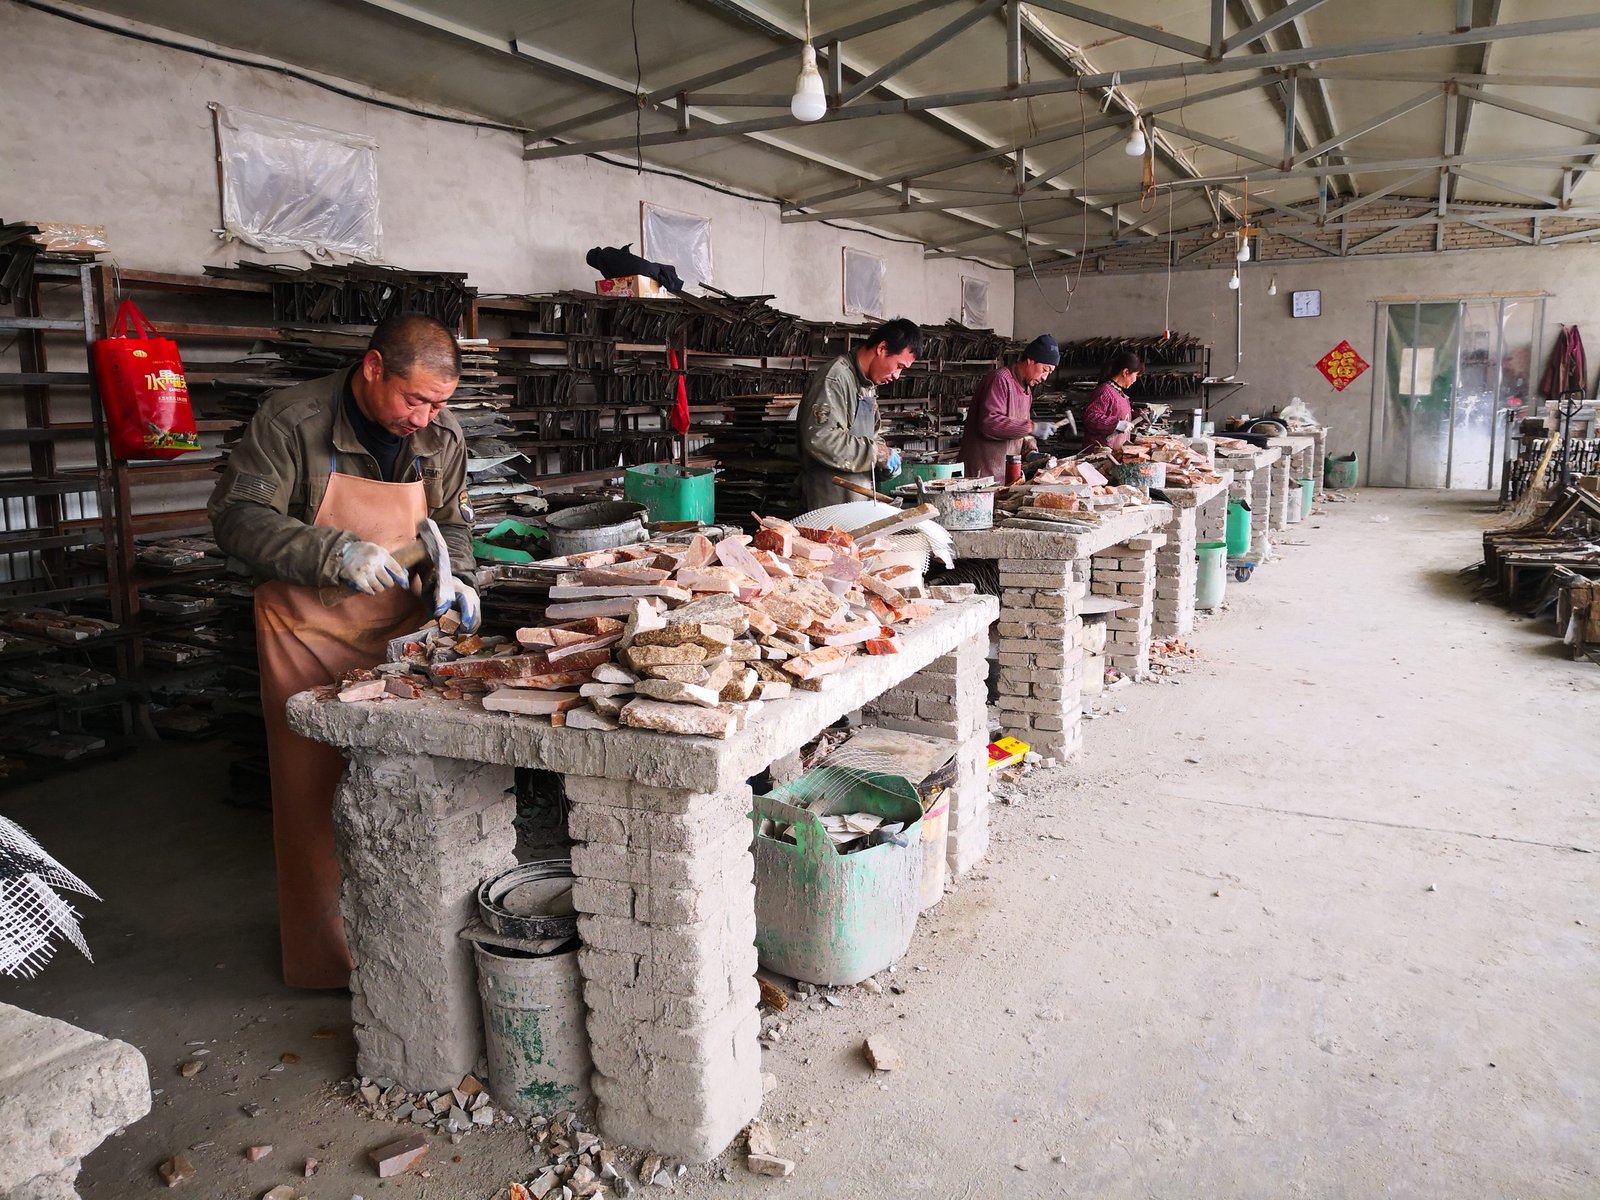
Aggregate trade data hides what a single factory actually ships. Top Stone Panels runs six product lines out of one Yixian operation, and the container math is what a distributor buys against.
| Line | Format | Monthly capacity |
|---|---|---|
| Stacked stone panels | 15x60cm / 15x55cm with L-corners | 80,000 m2 |
| Thin ledgestone | 36x10cm ultra-thin strips | 60,000 m2 |
| Z-panel cladding | 20x55cm / 15.2x61cm, interlocking | 50,000 m2 |
| Thin stone veneer | Random split-face strips, vein-sorted | 40,000 m2 |
| Flagstone and crazy paving | Random-geometry mesh sheets and pavers | 30,000 m2 |
| Stone columns | Custom pillar wraps and column kits | 10,000 sets |
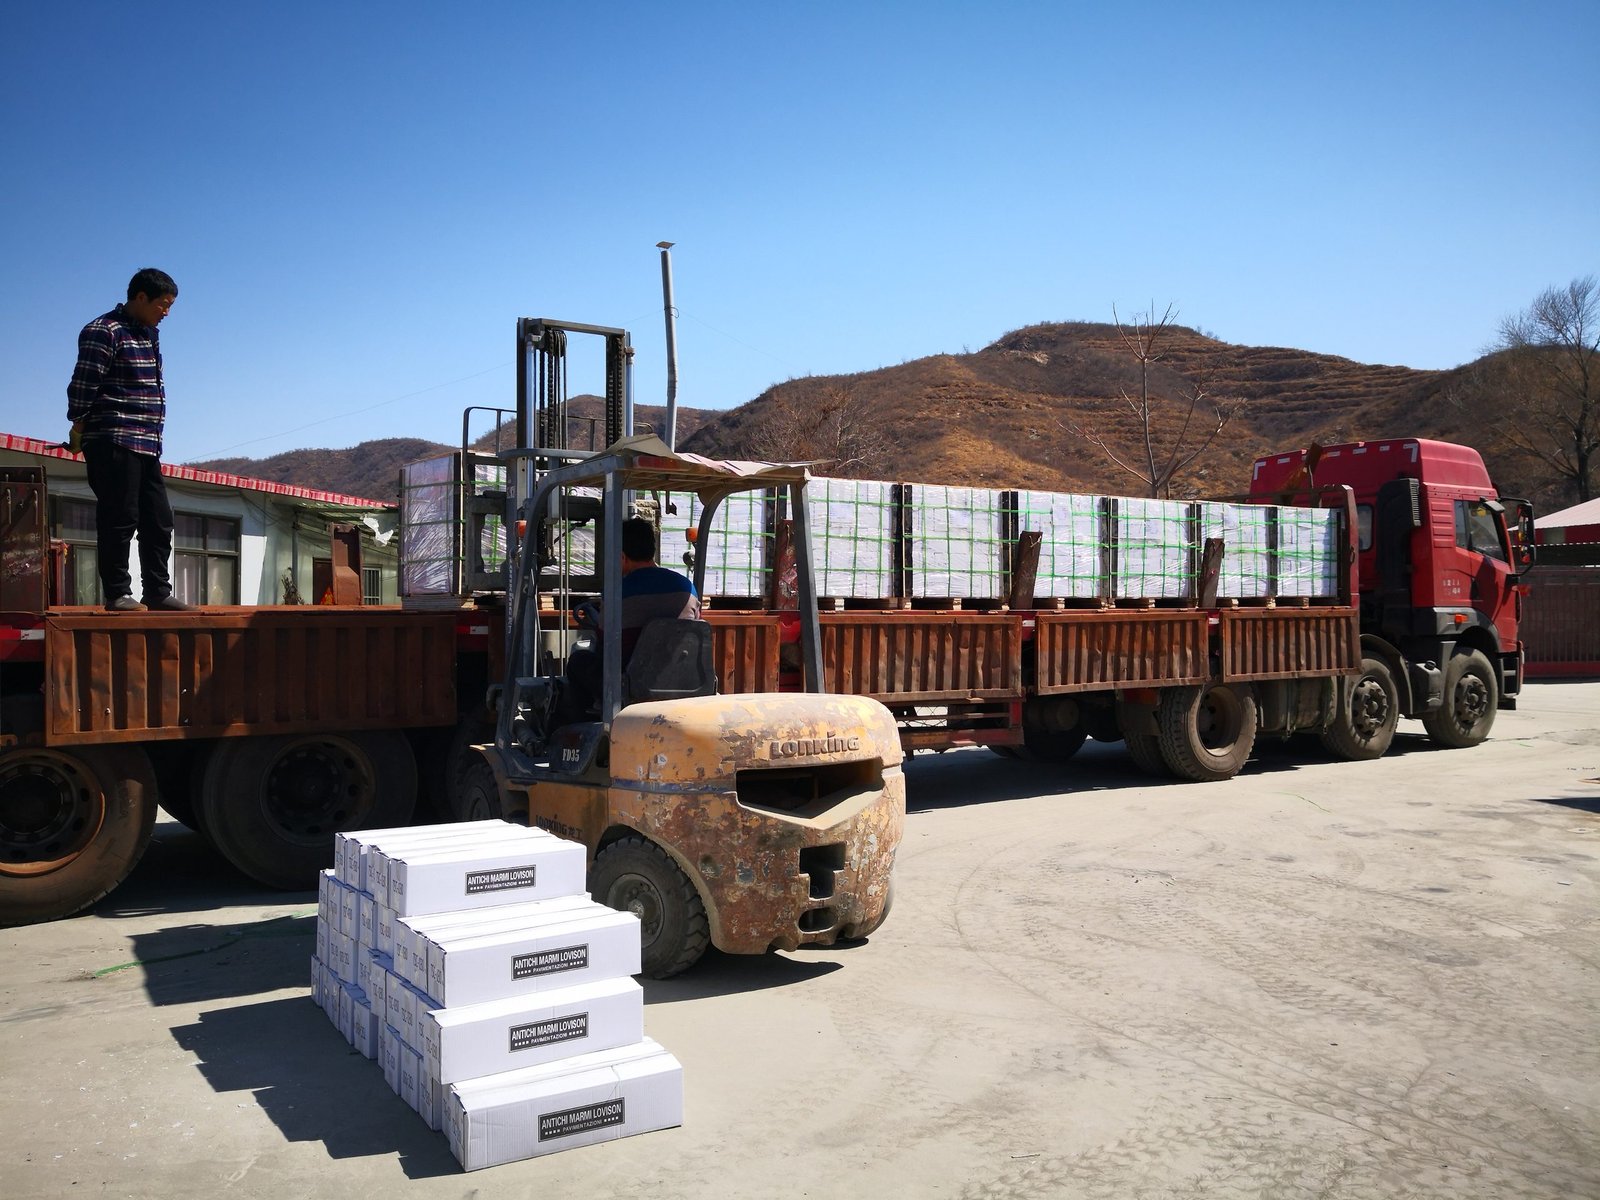
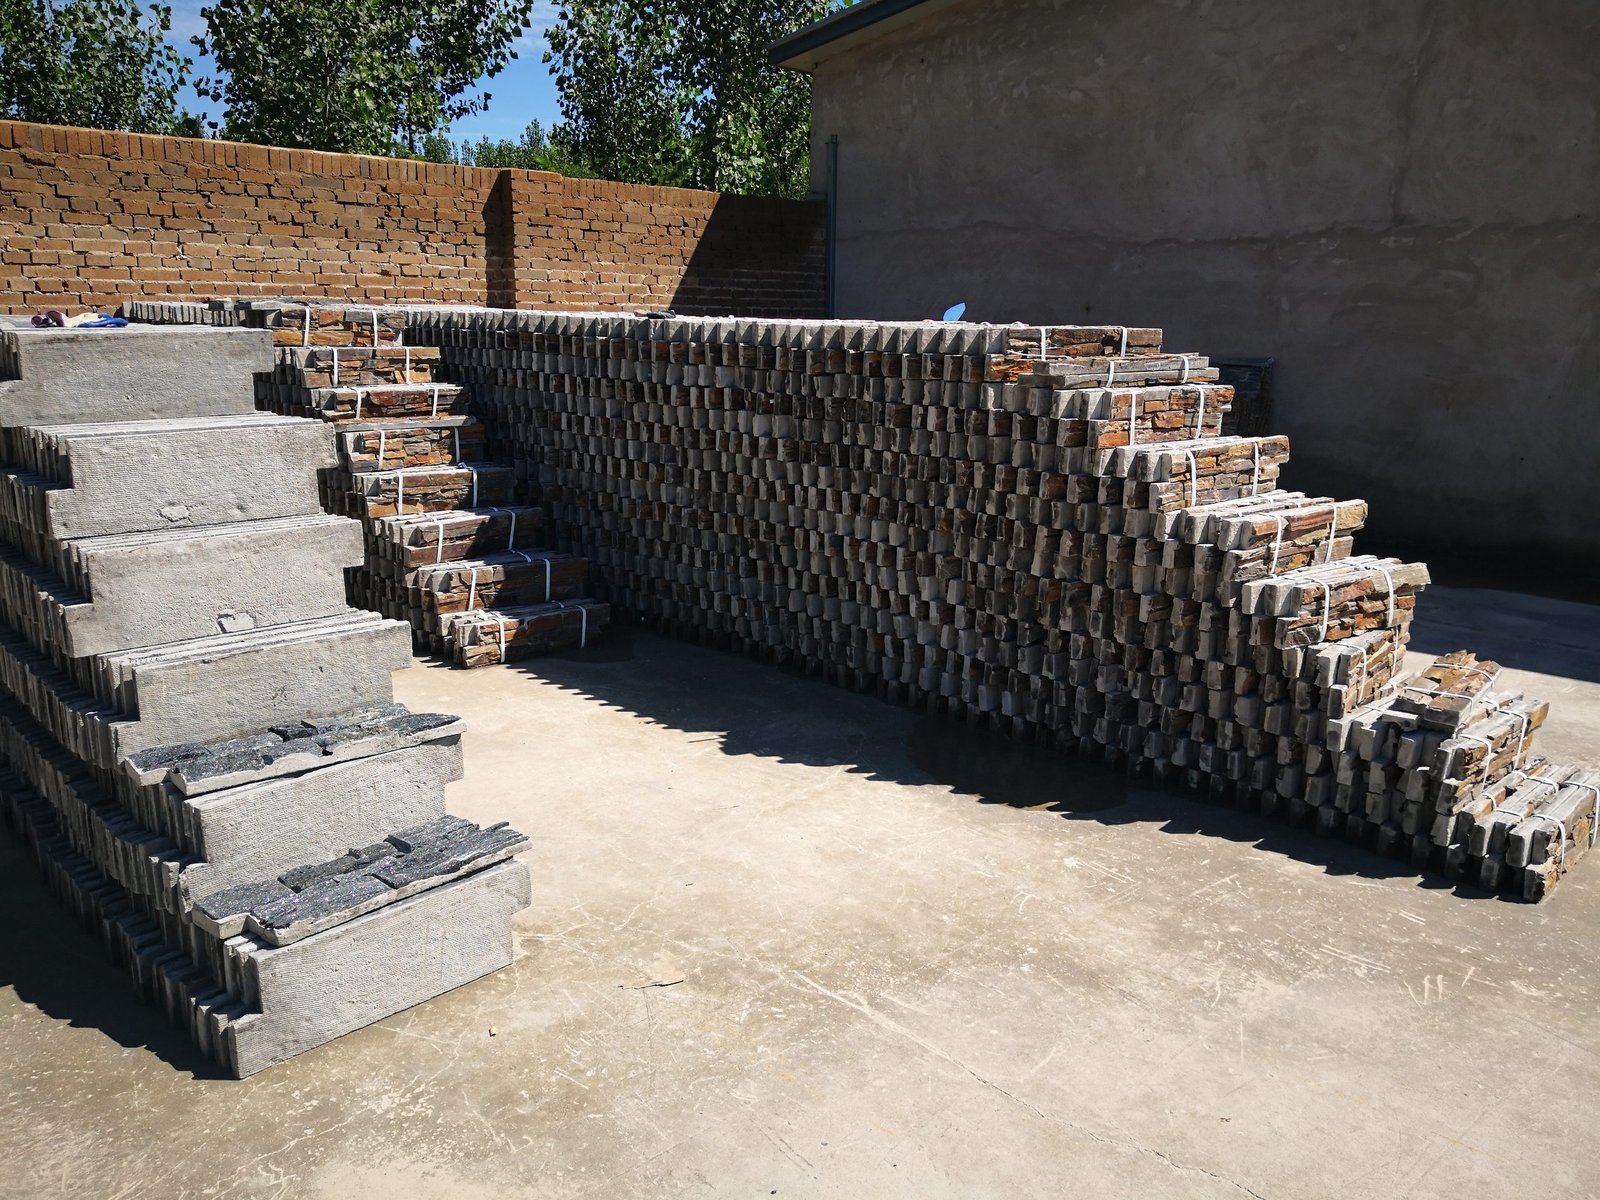
Capacity matters because 80,000 m2 per month of stacked stone is not a rounding error — it is a distributor’s ability to refill a bestseller without a production gap. For the buyer side of the lane, the container floor-area and cost comparison shows how to pack that capacity into 20GP and 40HQ efficiently, a decision that directly sets freight per square meter.
Where 2026 Volume Is Moving
The data points to four volume lanes for the current cycle. Granite-based formats are the resilient lane — production is recovering and US granite demand never left. Panelized culture stone and veneer hold steady because they replace full-thickness masonry at lower labor cost. Marble is the soft lane, with price pressure and slower pull-through in distribution. And engineered slabs — quartz and sintered products — keep taking countertop share, which partially explains the marble compression.
On the sourcing side, two trade events act as live demand meters. The Xiamen Stone Fair draws the global supply chain to China’s processing hub, and Coverings in the US measures Western distributor appetite; our Coverings vs Xiamen comparison reads both calendars, while the Canton Fair sourcing guide covers China’s broader export cycle. Long-term framing lives in the 2026 cladding market trends and the 2027 market outlook.
Distributors planning stock should treat the trend data as a mix decision: hold granite and panel lines deeper, keep marble exposure shorter, and price landed cost per square meter rather than per ton. The trade data rewards that habit.
Reading Trade Data Like a Buyer
Aggregate trade statistics mislead if read naively. Four rules keep them useful to a wholesale buyer:
- Separate value from volume. A falling dollar value with flat tonnage is a price story; a falling tonnage is a demand story. China 2024 is the textbook first case.
- Track the product lane, not the country total. Granite slabs, marble blocks, and slate veneer move on different cycles. The country total hides all three.
- Watch containers, not headlines. Freight per 20GP vs 40HQ, port congestion, and demurrage change landed cost more than quarterly export numbers do.
- Verify with your supply line. A factory that ships 220+ containers a year has a production record to check; a statistic cannot confirm an order.
Cross-reference official raw data when you need precision: the UN Comtrade database and ITC Trade Map publish country-level flows, and the Xiamen Stone Fair site posts current sourcing-cycle signals. The numbers in this article are customs-compiled figures for 2021-2024 plus first-party shipping data; treat any single-year snapshot as a point in a moving sequence.
FAQ
What countries export the most natural stone?
China is the largest exporter of worked stone, with US$5.03 billion in 2024 exports. Italy, India, Turkey, Brazil, and Spain form the next tier, each specialized in different stone types and formats.
Where does the US import most of its stone from?
Brazil leads US imports at 32.7% by value, followed by Italy at 17.3%, India at 14.4%, China at 12.4%, and Turkey at 10.9%, based on the 2021 annual customs snapshot.
Why did China’s stone export value fall in 2024?
Export value fell 20.9% to US$5.03 billion while volume stayed roughly flat at 7.81 million tons, indicating unit-price compression and mix shift rather than a drop in demand.
Which stone products are growing fastest?
Granite formats lead the recovery — 2024 half-year Chinese granite panel output grew 1.3% — and engineered slabs keep taking countertop share, while marble remains under price pressure.
How should a distributor read stone trade data before ordering?
Separate value from volume, track the product lane instead of the country total, watch container economics, and verify capacity and QC against the actual supplier rather than aggregate statistics.
Conclusion
Global stone trade data says the industry is not shrinking — it is repricing and remixing. China still exports more worked stone than anyone, the US still imports more natural stone than anyone, and the buyer’s edge comes from reading the lane, not the headline.
- China exported US$5.03 billion of stone in 2024; value fell and volume held, so price and mix drove the drop.
- The US import market runs past US$2.3 billion, supplied by Brazil, Italy, India, China, and Turkey.
- The 2025 US tariff reset raised landed cost on Chinese stone and made DDP and lane choice central decisions.
- Granite panels are the resilient format; marble is the soft lane; panelized culture stone holds steady through distribution.
Top Stone Panels ships stacked stone, thin ledgestone, veneer, Z-panels, flagstone, and columns from Xingang at 220+ containers a year, with capacities and documentation to back a 2026-2027 inventory plan. Ask for the factory production calendar and landed-cost quote at topstonepanels.com.